In this article
Why survey at all
Wireless behaviour is determined by the building, and buildings are unpredictable in ways no rule of thumb survives. A 3,000 square foot suite of glass-partitioned offices and a 3,000 square foot open floor with a foil-backed insulation wall need different designs. Anyone quoting from square footage alone is guessing, and you are paying for the guess.
A survey answers four questions no datasheet can:
- How many access points does this specific building actually need?
- Where exactly do they go?
- What is already in the air that will fight them?
- After installation, did we get what was designed?
The four survey types
People say "site survey" as though it were one thing. It is four, and they answer different questions.
1. Predictive survey
A model built in software from your floor plans. Walls are drawn and assigned attenuation values by material; access points are placed virtually; the software predicts coverage. Fast, does not require site access, and excellent for budgeting.
Its weakness is that it is only as good as the material assumptions. A wall marked "drywall" that is actually drywall over a metal stud with foil-backed insulation will be off by a large margin. Predictive is a starting point, not a design you build from unquestioned.
2. Passive survey
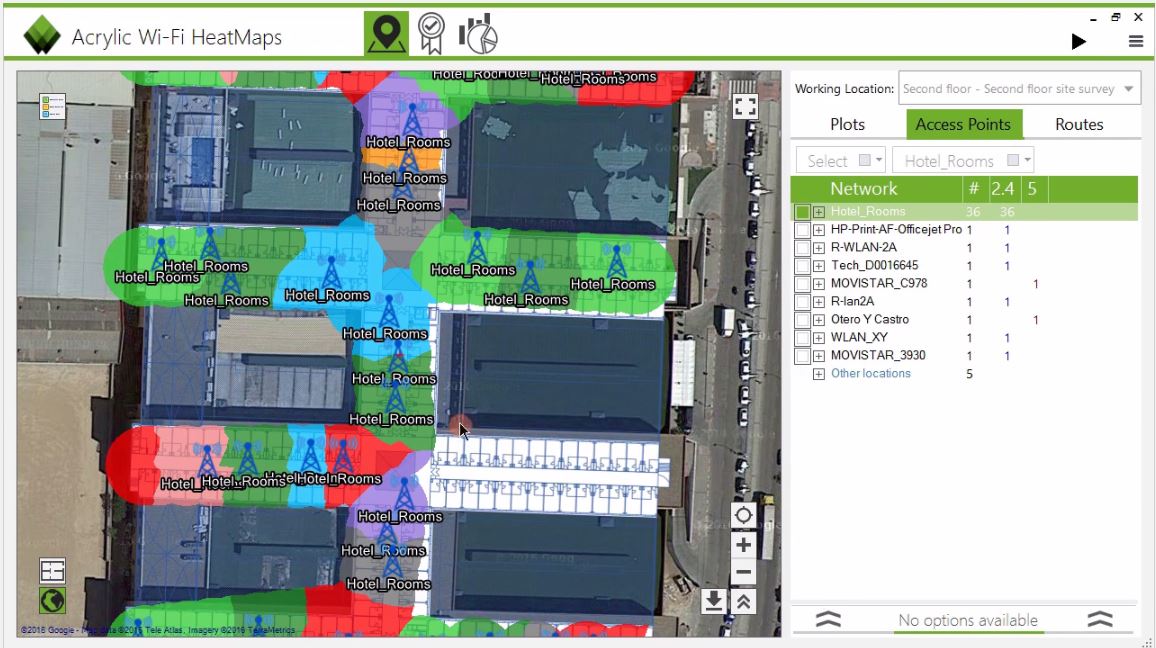
A technician walks the building with a laptop or tablet and survey adapters, recording what is in the air without connecting to anything: signal strength, signal-to-noise ratio, channel utilisation, every access point audible including the neighbours'. Results are plotted against the floor plan as heat maps.
This tells you what is really happening today. It is the survey type most people picture, and it is essential for any rescue job on an existing network.
3. Active survey
The survey device associates with the network and measures actual performance: throughput, retry rates, packet loss, latency and roaming behaviour as the technician walks. This is the only survey that answers "will it work for users", because coverage and usable performance are not the same thing.
A location can show a strong signal on a passive heat map and still deliver terrible throughput because of co-channel contention or interference. Active surveying exposes that.
4. Spectrum analysis
A spectrum analyser looks at raw RF energy across the band regardless of whether it is WiFi. This is how you find microwave ovens, wireless cameras, cordless headsets, motor controllers, badge readers and Bluetooth gear that are consuming airtime invisibly.
WiFi adapters cannot see non-WiFi interference — they simply report the channel as busy. If a location has an unexplained problem, spectrum is usually where the explanation lives.
AP-on-a-stick: the step that pays for itself
For difficult buildings, the most valuable survey technique is also the most physical. A live access point goes on a battery-powered tripod mast at a proposed mounting position, and the technician surveys the real coverage it produces.
This resolves questions that models cannot:
- Does this position actually reach down the aisle, or does the racking block it?
- How far does the signal make it into cold storage before the insulated panel kills it?
- Is one access point enough for this mezzanine, or does the floor deck cut it in half?
- Does this exterior position cover the yard, or does the roll-up door reflect it back inside?
Two or three of these tests reliably change a design. They cost a few hours; a wrongly specified deployment costs considerably more.
What good survey data looks like
| Metric | Target for general use | Target for voice / video / scanners |
|---|---|---|
| Signal strength (RSSI) | −67 dBm or better | −65 dBm or better |
| Signal-to-noise ratio | 25 dB or better | 25–30 dB |
| Channel utilisation | Under 50% | Under 30% |
| Cell overlap | 15–20% at −67 dBm | 20% for reliable roaming |
| Co-channel audibility | Minimise APs on same channel above −85 dBm | Same, stricter |
| Retry rate | Under 10% | Under 5% |
Two nuances worth knowing. First, "more signal" is not automatically better — excessive overlap creates co-channel contention, where access points on the same channel take turns instead of working simultaneously. Second, survey at the height and with the hardware your users actually use. A survey taken at chest height with a high-end laptop adapter overstates what a scanner at waist height on a forklift will experience.
The deliverables you should insist on
A survey you cannot act on is a receipt, not a report. Whoever performs it should hand you:
- Heat maps for signal strength, SNR, data rate and channel utilisation, per band, over your floor plan
- Interference findings — co-channel contention, adjacent-channel overlap and any non-WiFi sources located
- An access point placement plan — exact positions, models, mounting heights, antenna types and orientation
- A channel and transmit power plan, not "leave it on auto"
- Capacity analysis — expected device counts per area against realistic per-AP capacity
- A prioritised remediation list if surveying an existing network
- The raw survey files, so a future engineer can re-open the data
Own your data
Insist that the survey report and raw files are yours, and that you may quote the work elsewhere. A contractor who withholds the data is relying on lock-in rather than on being the best value. We hand ours over as standard.
The survey after the survey
The pre-deployment survey designs the network. The post-deployment survey proves it was delivered — and it is the half that most often gets skipped.
After installation we repeat the passive and active walks against the same floor plan and compare to the design targets. Where reality differs from prediction, we adjust: relocate an access point, change an antenna, retune power, revise the channel plan.
Then re-survey periodically. Buildings change. New walls go up, racking gets reconfigured, a neighbour installs eight access points at full power on your channels. An annual walkthrough catches drift long before it turns into a helpdesk trend.
Can you survey it yourself?
Partly, and it is worth doing. Free and low-cost mobile apps will show you signal strength and which channels are congested, and walking your own building with one will tell you whether your suspicion about the back corner is real.
What consumer tools cannot do: measure signal-to-noise properly, plot results against a floor plan, capture retry rates and roaming behaviour, see non-WiFi interference at all, or model a design before you buy hardware. Phone measurements are also not comparable between devices, so a reading on one handset means little about another.
Use a phone app to decide whether you have a problem. Use a professional survey to decide what to do about it.
If you would like the professional version, this is what our survey service includes.
Need this done in your building?
We survey, design, install and support commercial networks across Greater Los Angeles. Request a consultation or call 626-289-0188.